A lot has been made of President Obama's tax increases for couples making over $250,000 a year. Both sides of the debate have engaged in hyperbole - the pro-tax side pointing to the 94% tax rate in the early 1960s as evidence that taxes are at an historical low (without mentioning that nobody paid that top rate); and the anti-tax side claiming that slight increases in taxes on the top 1% of incomes create powerful disincentives to work. But what would this hypothetical couple's taxes have been historically? How different are tax rates today than they used to be? I haven't seen this data, so I had to put it together myself:
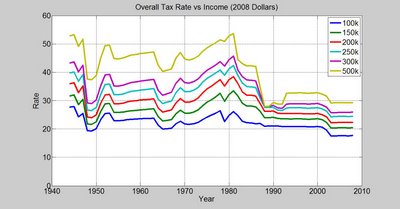
For most people, aside from the period of "bracket creep" in the 1970s, tax rates have fallen in a very small band since 1954. Taxes are presently at their lowest levels for all groups (aside from the $500k+ earners, who hit their low in 1988-89 and then saw rates go up in the "Read My Lips" era.) One important thing to keep in mind is that because of increasing inequality, earning an inflation-adjusted $500k was much less common in the past than it is today.
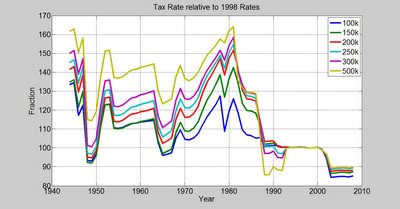
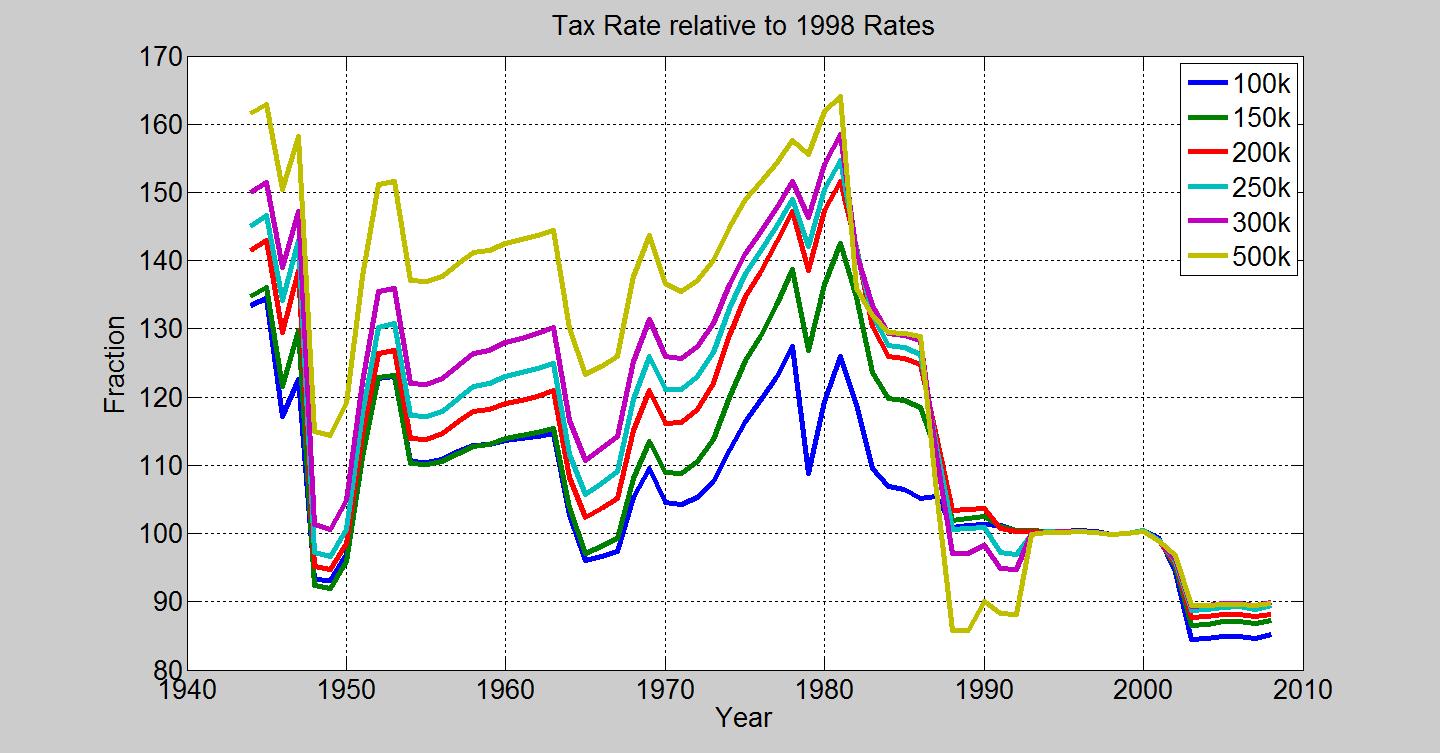
This graph shows tax rates as a percentage of their 1998 levels:


No comments:
Post a Comment